The EV charging industry expanded again in 2024 as public charger deployment accelerated, policy targets hardened, and major markets mapped out much larger buildouts through 2030.
These EV charging industry statistics highlight the global growth rate, regional deployment needs, national targets, and recent U.S. infrastructure trends.
ev charging industry statistics
Key EV Charging Industry Statistics
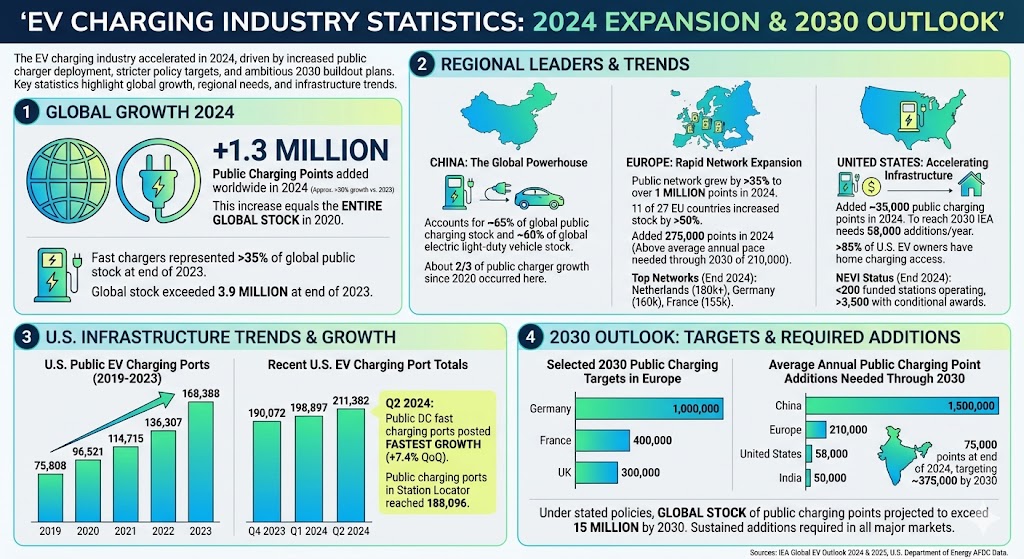
More than 1.3 million public charging points were added worldwide in 2024.
That global increase represented growth of more than 30% versus 2023.
The number of public charging points added in 2024 was approximately equal to the entire global stock available in 2020.
About two-thirds of public charger growth since 2020 has occurred in China.
China now accounts for about 65% of the world’s public charging stock and about 60% of global electric light-duty vehicle stock.
Europe’s public charging network grew by more than 35% in 2024 to reach just over 1 million points.
Within the European Union, 11 of 27 countries increased public charging stock by more than 50% in 2024.
The Netherlands had the largest public charging network in Europe at over 180,000 points at the end of 2024.
Germany followed with 160,000 public charging points, and France reached 155,000.
Europe needs an average of 210,000 public charging point additions per year through 2030 in the IEA’s Stated Policies Scenario.
Europe added 275,000 public charging points in 2024, which is already above the average annual pace needed through 2030.
France is targeting 400,000 public charging stations by 2030, while the United Kingdom is aiming for at least 300,000.
Germany has previously set a target of 1 million public charging points by 2030.
In the United States, public light-duty vehicle charging points rise from almost 200,000 at the end of 2024 to more than 500,000 by 2030 in the IEA scenario.
The United States added about 35,000 public charging points in 2024.
To reach the IEA’s 2030 scenario, the United States would need to average 58,000 public charging point additions per year.
Recent survey findings cited by the IEA suggest that over 85% of U.S. EV owners have access to home charging.
At the end of 2024, fewer than 200 NEVI-funded stations were operating in the United States, though more than 3,500 had conditional awards or agreements in place.
India had 75,000 public charging points at the end of 2024 and would need around 50,000 additions per year to reach about 375,000 by 2030.
The global public charging network is projected to exceed 15 million points by 2030 under stated policies.
At the end of 2023, there were 3.9 million public charging points worldwide.
Fast chargers represented more than 35% of global public charging stock at the end of 2023.
U.S. public EV charging ports rose from 75,808 in 2019 to 168,388 in 2023.
U.S. public charging station locations climbed from 23,951 in 2019 to 64,641 in 2023.
In Q1 2024, the United States had 198,897 total EV charging ports in the Station Locator.
In Q2 2024, that total rose to 211,382.
Public EV charging ports in the Station Locator reached 188,096 in Q2 2024.
Public DC fast charging ports posted the fastest growth in Q2 2024, increasing by 7.4% quarter over quarter.
EV Charging Industry Charts
Average annual public charging point additions needed through 2030
Label
Bar
Value
China
1,500,000
Europe
210,000
United States
58,000
India
50,000
Max = 1,500,000. Widths: China 100.00%, Europe 14.00%, United States 3.87%, India 3.33%
Selected 2030 public charging targets in Europe
Label
Bar
Value
Germany
1,000,000
France
400,000
United Kingdom
300,000
Max = 1,000,000. Widths: Germany 100.00%, France 40.00%, United Kingdom 30.00%
Under stated policies, the global stock of public charging points is projected to exceed 15 million by 2030. China, Europe, the United States, and India all require sustained annual additions to reach their projected public charging stocks.
Sources
IEA, Global EV Outlook 2025, Electric vehicle charging: https://www.iea.org/reports/global-ev-outlook-2025/electric-vehicle-charging
IEA, Global EV Outlook 2025 PDF: https://iea.blob.core.windows.net/assets/7ea38b60-3033-42a6-9589-71134f4229f4/GlobalEVOutlook2025.pdf
IEA, Global EV Outlook 2024, Outlook for electric vehicle charging infrastructure: https://www.iea.org/reports/global-ev-outlook-2024/outlook-for-electric-vehicle-charging-infrastructure
IEA, Electric vehicles overview: https://www.iea.org/energy-system/transport/electric-vehicles
U.S. Department of Energy AFDC, U.S. Public Electric Vehicle Charging Infrastructure: https://afdc.energy.gov/data/10972
U.S. Department of Energy AFDC, Electric Vehicle Charging Infrastructure Trends: https://afdc.energy.gov/fuels/electricity-infrastructure-trends
NREL/AFDC, Electric Vehicle Charging Infrastructure Trends from the Alternative Fueling Station Locator, First Quarter 2024: https://afdc.energy.gov/files/u/publication/electric_vehicle_charging_infrastructure_trends_first_quarter_2024.pdf
NREL/AFDC, Electric Vehicle Charging Infrastructure Trends from the Alternative Fueling Station Locator, Second Quarter 2024: https://afdc.energy.gov/files/u/publication/electric_vehicle_charging_infrastructure_trends_second_quarter_2024.pdf
NREL/AFDC, Electric Vehicle Charging Infrastructure Trends from the Alternative Fueling Station Locator, Fourth Quarter 2023: https://afdc.energy.gov/files/u/publication/electric_vehicle_charging_infrastructure_trends_fourth_quarter_2023.pdf