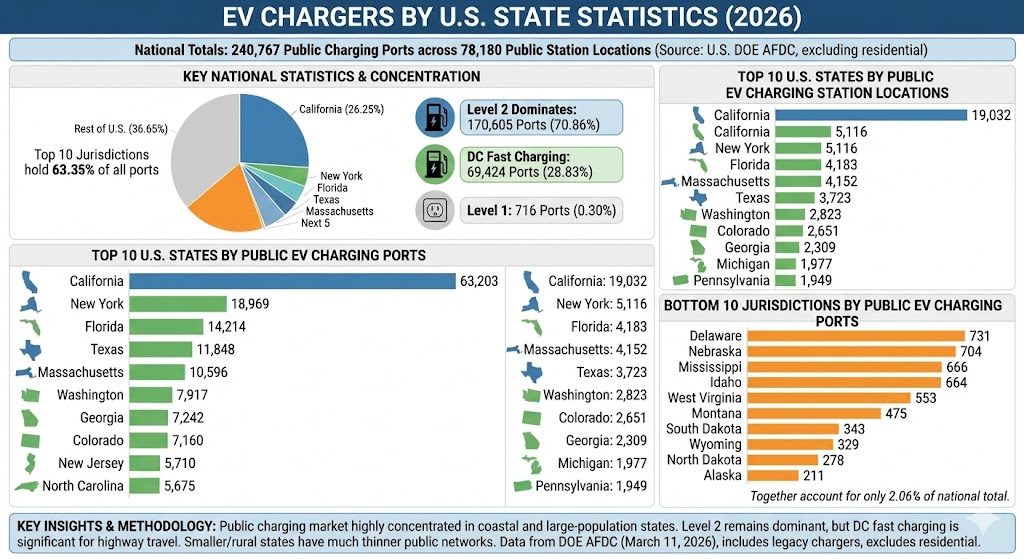
The latest U.S. Department of Energy Alternative Fuels Data Center update shows 240,767 public EV charging ports across 78,180 public station locations in the United States and the District of Columbia. These figures exclude residential charging and include legacy chargers.
ev chargers by US States statistics
Key EV charger by state statistics
California leads the country with 63,203 public charging ports across 19,032 public station locations.
New York ranks second with 18,969 public charging ports, followed by Florida with 14,214 and Texas with 11,848.
The top 5 jurisdictions hold 49.35% of all public EV charging ports, while the top 10 hold 63.35%.
California alone accounts for 26.25% of all public EV charging ports reported by AFDC.
Level 2 charging dominates the national mix with 170,605 ports, equal to 70.86% of all public ports.
DC fast charging totals 69,424 ports nationally, or 28.83% of the public charging network.
Level 1 charging is now a very small slice of public infrastructure at just 716 ports, or 0.30% of the total.
Massachusetts stands out with 10,596 public ports from 4,152 public station locations, giving it the fifth-largest public port total in the country.
The bottom 10 jurisdictions by public charging ports together account for only 2.06% of the national total.
Alaska has the fewest public charging ports in the AFDC table at 211, while Wyoming has 329 and South Dakota has 343.
Top 10 U.S. states by public EV charging ports
This chart ranks jurisdictions by total public EV charging ports.
Label
Bar
Value
California
63,203
New York
18,969
Florida
14,214
Texas
11,848
Massachusetts
10,596
Washington
7,917
Georgia
7,242
Colorado
7,160
New Jersey
5,710
North Carolina
5,675
Max = 63,203. Widths: California 100.00%, New York 30.01%, Florida 22.49%, Texas 18.75%, Massachusetts 16.77%, Washington 12.53%, Georgia 11.46%, Colorado 11.33%, New Jersey 9.03%, North Carolina 8.98%
Top 10 U.S. states by public EV charging station locations
Station locations count physical public charging sites, while ports count the individual connectors available at those sites.
Label
Bar
Value
California
19,032
New York
5,116
Florida
4,183
Massachusetts
4,152
Texas
3,723
Washington
2,823
Colorado
2,651
Georgia
2,309
Michigan
1,977
Pennsylvania
1,949
Max = 19,032. Widths: California 100.00%, New York 26.88%, Florida 21.98%, Massachusetts 21.82%, Texas 19.56%, Washington 14.83%, Colorado 13.93%, Georgia 12.13%, Michigan 10.39%, Pennsylvania 10.24%
National public EV charging port mix by charger type
AFDC breaks public charging ports into Level 1, Level 2, and DC fast charging.
Label
Bar
Value
Level 2
170,605
DC Fast
69,424
Level 1
716
Max = 170,605. Widths: Level 2 100.00%, DC Fast 40.69%, Level 1 0.42%
Bottom 10 U.S. jurisdictions by public EV charging ports
This view shows the smallest public charging port totals in the AFDC table.
Label
Bar
Value
Delaware
731
Nebraska
704
Mississippi
666
Idaho
664
West Virginia
553
Montana
475
South Dakota
343
Wyoming
329
North Dakota
278
Alaska
211
Max = 731. Widths: Delaware 100.00%, Nebraska 96.31%, Mississippi 91.11%, Idaho 90.83%, West Virginia 75.65%, Montana 64.98%, South Dakota 46.92%, Wyoming 45.01%, North Dakota 38.03%, Alaska 28.86%
Full state ranking for public EV chargers
The table below is sorted by public charging ports in descending order. The District of Columbia is included because AFDC reports it as a separate jurisdiction.
Rank
State
Public station locations
Public charging ports
Level 2 ports
DC fast ports
Ports per station
1
California
19,032
63,203
45,538
17,370
3.32
2
New York
5,116
18,969
15,930
3,028
3.71
3
Florida
4,183
14,214
9,567
4,626
3.40
4
Texas
3,723
11,848
7,200
4,648
3.18
5
Massachusetts
4,152
10,596
8,860
1,730
2.55
6
Washington
2,823
7,917
5,917
1,985
2.80
7
Georgia
2,309
7,242
5,114
2,036
3.14
8
Colorado
2,651
7,160
5,552
1,553
2.70
9
New Jersey
1,748
5,710
3,681
2,015
3.27
10
North Carolina
1,897
5,675
3,912
1,754
2.99
11
Pennsylvania
1,949
5,534
3,721
1,800
2.84
12
Illinois
1,693
5,415
2,962
2,449
3.20
13
Maryland
1,660
5,389
3,981
1,396
3.25
14
Virginia
1,799
5,348
3,658
1,663
2.97
15
Michigan
1,977
5,344
3,777
1,556
2.70
16
Ohio
1,892
5,126
3,708
1,412
2.71
17
Connecticut
1,508
4,666
3,911
745
3.09
18
Arizona
1,474
4,564
3,169
1,393
3.10
19
Oregon
1,617
4,177
2,900
1,240
2.58
20
Missouri
1,303
3,172
2,387
785
2.43
21
Minnesota
1,085
3,027
2,066
948
2.79
22
Tennessee
1,096
2,983
2,025
957
2.72
23
Utah
970
2,921
2,131
786
3.01
24
Nevada
641
2,651
1,499
1,148
4.14
25
Wisconsin
839
2,175
1,366
800
2.59
26
South Carolina
647
2,035
1,155
877
3.15
27
Indiana
678
2,022
1,125
897
2.98
28
North Carolina
1,897
5,675
3,912
1,754
2.99
29
District of Columbia
323
1,133
1,072
59
3.51
30
New Mexico
446
1,136
586
547
2.55
31
Kentucky
379
1,095
685
406
2.89
32
Arkansas
363
1,083
820
263
2.98
33
Hawaii
374
972
790
181
2.60
34
Louisiana
278
858
482
376
3.09
35
Rhode Island
336
842
697
125
2.51
36
Alabama
540
1,660
799
859
3.07
37
Oklahoma
383
1,618
634
983
4.22
38
Maine
651
1,595
1,221
371
2.45
39
Arizona
1,474
4,564
3,169
1,393
3.10
40
Kansas
573
1,341
980
361
2.34
41
Iowa
481
1,240
717
523
2.58
42
New Hampshire
287
779
456
320
2.71
43
Delaware
227
731
432
297
3.22
44
Nebraska
318
704
475
229
2.21
45
Mississippi
218
666
342
324
3.06
46
Idaho
240
664
390
274
2.77
47
West Virginia
186
553
333
218
2.97
48
Montana
157
475
221
254
3.03
49
South Dakota
119
343
183
160
2.88
50
Wyoming
119
329
161
167
2.76
51
North Dakota
109
278
130
147
2.55
52
Alaska
77
211
112
99
2.74
What the state-by-state numbers show
The public charging market remains highly concentrated. California is still the clear leader in both station locations and charging ports, and it has more than three times as many public ports as New York, the second-ranked jurisdiction. Florida, Texas, and Massachusetts also sit well above the rest of the field.
The national mix shows how mature the public market has become. Level 2 ports still make up the majority of public connectors, but DC fast charging already represents more than a quarter of the total, which matters for highway travel and quicker turnaround times.
At the lower end of the ranking, several smaller or more rural states remain below 700 public ports. That does not necessarily mean they have no statewide coverage, but it does show that their public networks are much thinner than the leading coastal and large-population markets.
Methodology
All figures in this article come from the U.S. Department of Energy Alternative Fuels Data Center Station Counts by State table, using the public-access view available on March 11, 2026. For electric charging, AFDC reports both station locations and charging ports. Residential charging infrastructure is not included, and AFDC notes that legacy chargers are included.
Sources
U.S. Department of Energy Alternative Fuels Data Center, Alternative Fueling Station Counts by State: https://afdc.energy.gov/stations/states
U.S. Department of Energy Alternative Fuels Data Center, Electric Vehicle Charging Ports by State: https://afdc.energy.gov/data/10366